.svg)
.svg)
.svg)
.svg)
.svg)

.svg)
.svg)
.svg)
.svg)


Shoresh Shafei, Justin Benson and Luke Evans
A Spreedly customer, unsatisfied with the support they were receiving from their existing gateway, was considering migrating to a new provider. To make sure that the performance of the new gateway was comparable to the one already in use, they asked Spreedly to help by analyzing our data and comparing the two gateway performances.
When it comes to choosing the right gateway, Spreedly is encouraging merchants to consider not only the costs and the feature list of gateways, but to use the power of data to investigate their efficiency (decline rates), and reliability (support they provide for different currencies, latency times) as well. Gateway Index in the past and our recent articles like is your payment gateway good enough? Are part of the efforts aiming at helping businesses choose the right gateway(s).
We were happy to help them make a decision that has the potential to have a major impact on their business. In our report we focused on 6 factors when comparing their current gateway (GA) with the gateway they were considering (GB):
- The total number of active merchants and transactions on each gateway
- The total and declined transactions
- The total number of transactions and decline rates in different currencies
- Average ticket size in each currency
- The transaction decline rate fluctuations over time
- Gateway latencies
1. Number of active merchants and transactions
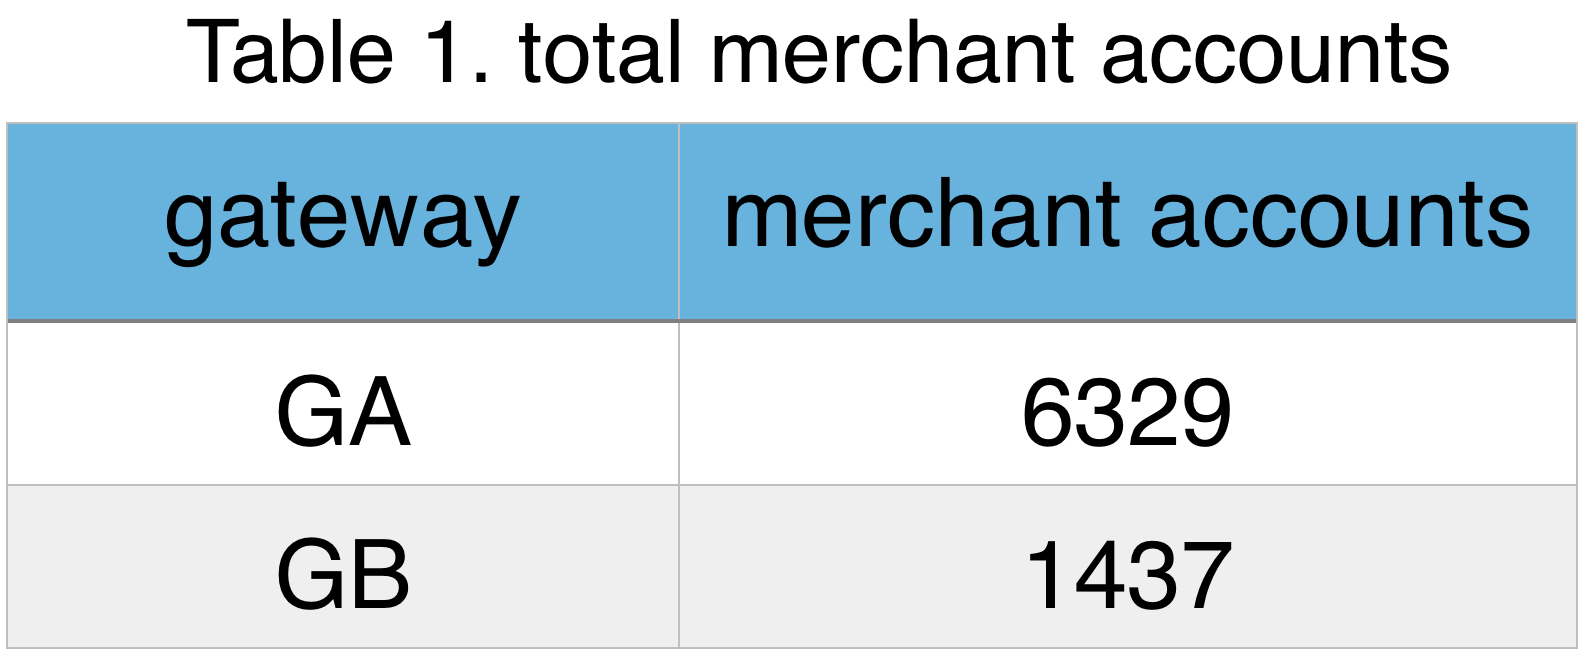
The total number of merchants actively using each gateway via Spreedly are given in Table 1. At the present moment, GA serves a larger pool of merchants, but both sample sizes are large enough that we were not worried about the data being skewed.
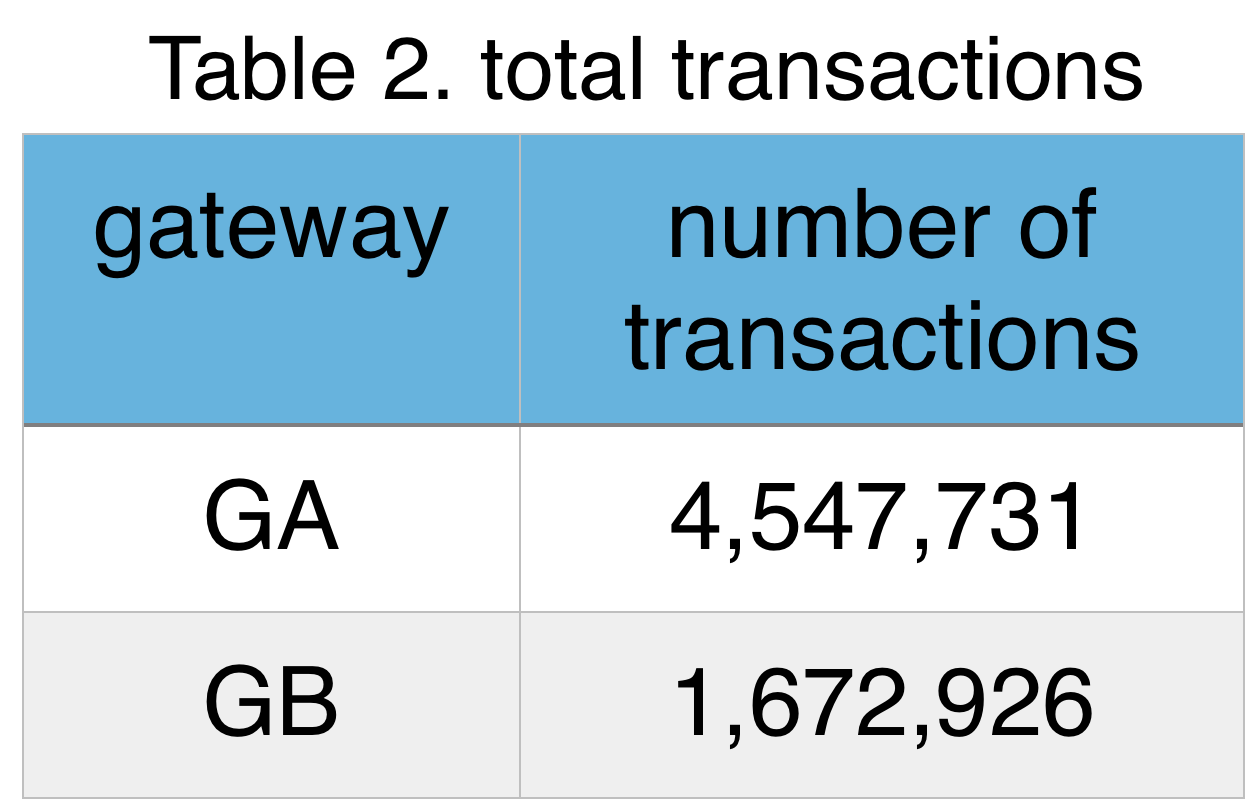
The total number of transactions for each gateways is given in Table 2. GA has transacted almost 3 times more than GB. This makes sense as currently GA is serving a pool of merchants 4 times bigger than the GB customers.
2. Decline rates
We have discussed decline rates in the past. To investigate the decline rates for GA and GB, we will only consider Authorization, Capture, Credit (reimbursement), Purchase, and Verification transactions. Figure 1 illustrates the barplot of the gateway processing failure ratio for the transaction types mentioned above. In this figure the red (green) bars represent GA (GB). The numbers in each bar are the total number of failed transaction for that particular transaction type. Ratio is the percentage occurrence for the transaction type.
One should note that gateway processing failed error message, recorded on Spreedly's database when a transaction is failed, can be related to many factors and is NOT solely due to a gateway failure. However, the effects of these factors, that were discussed in more details -- here are minimized when two or multiple gateways that to some extent are active in the same geographic locations accepting similar currencies. An example is Stripe vs. PayPal performance comparison.
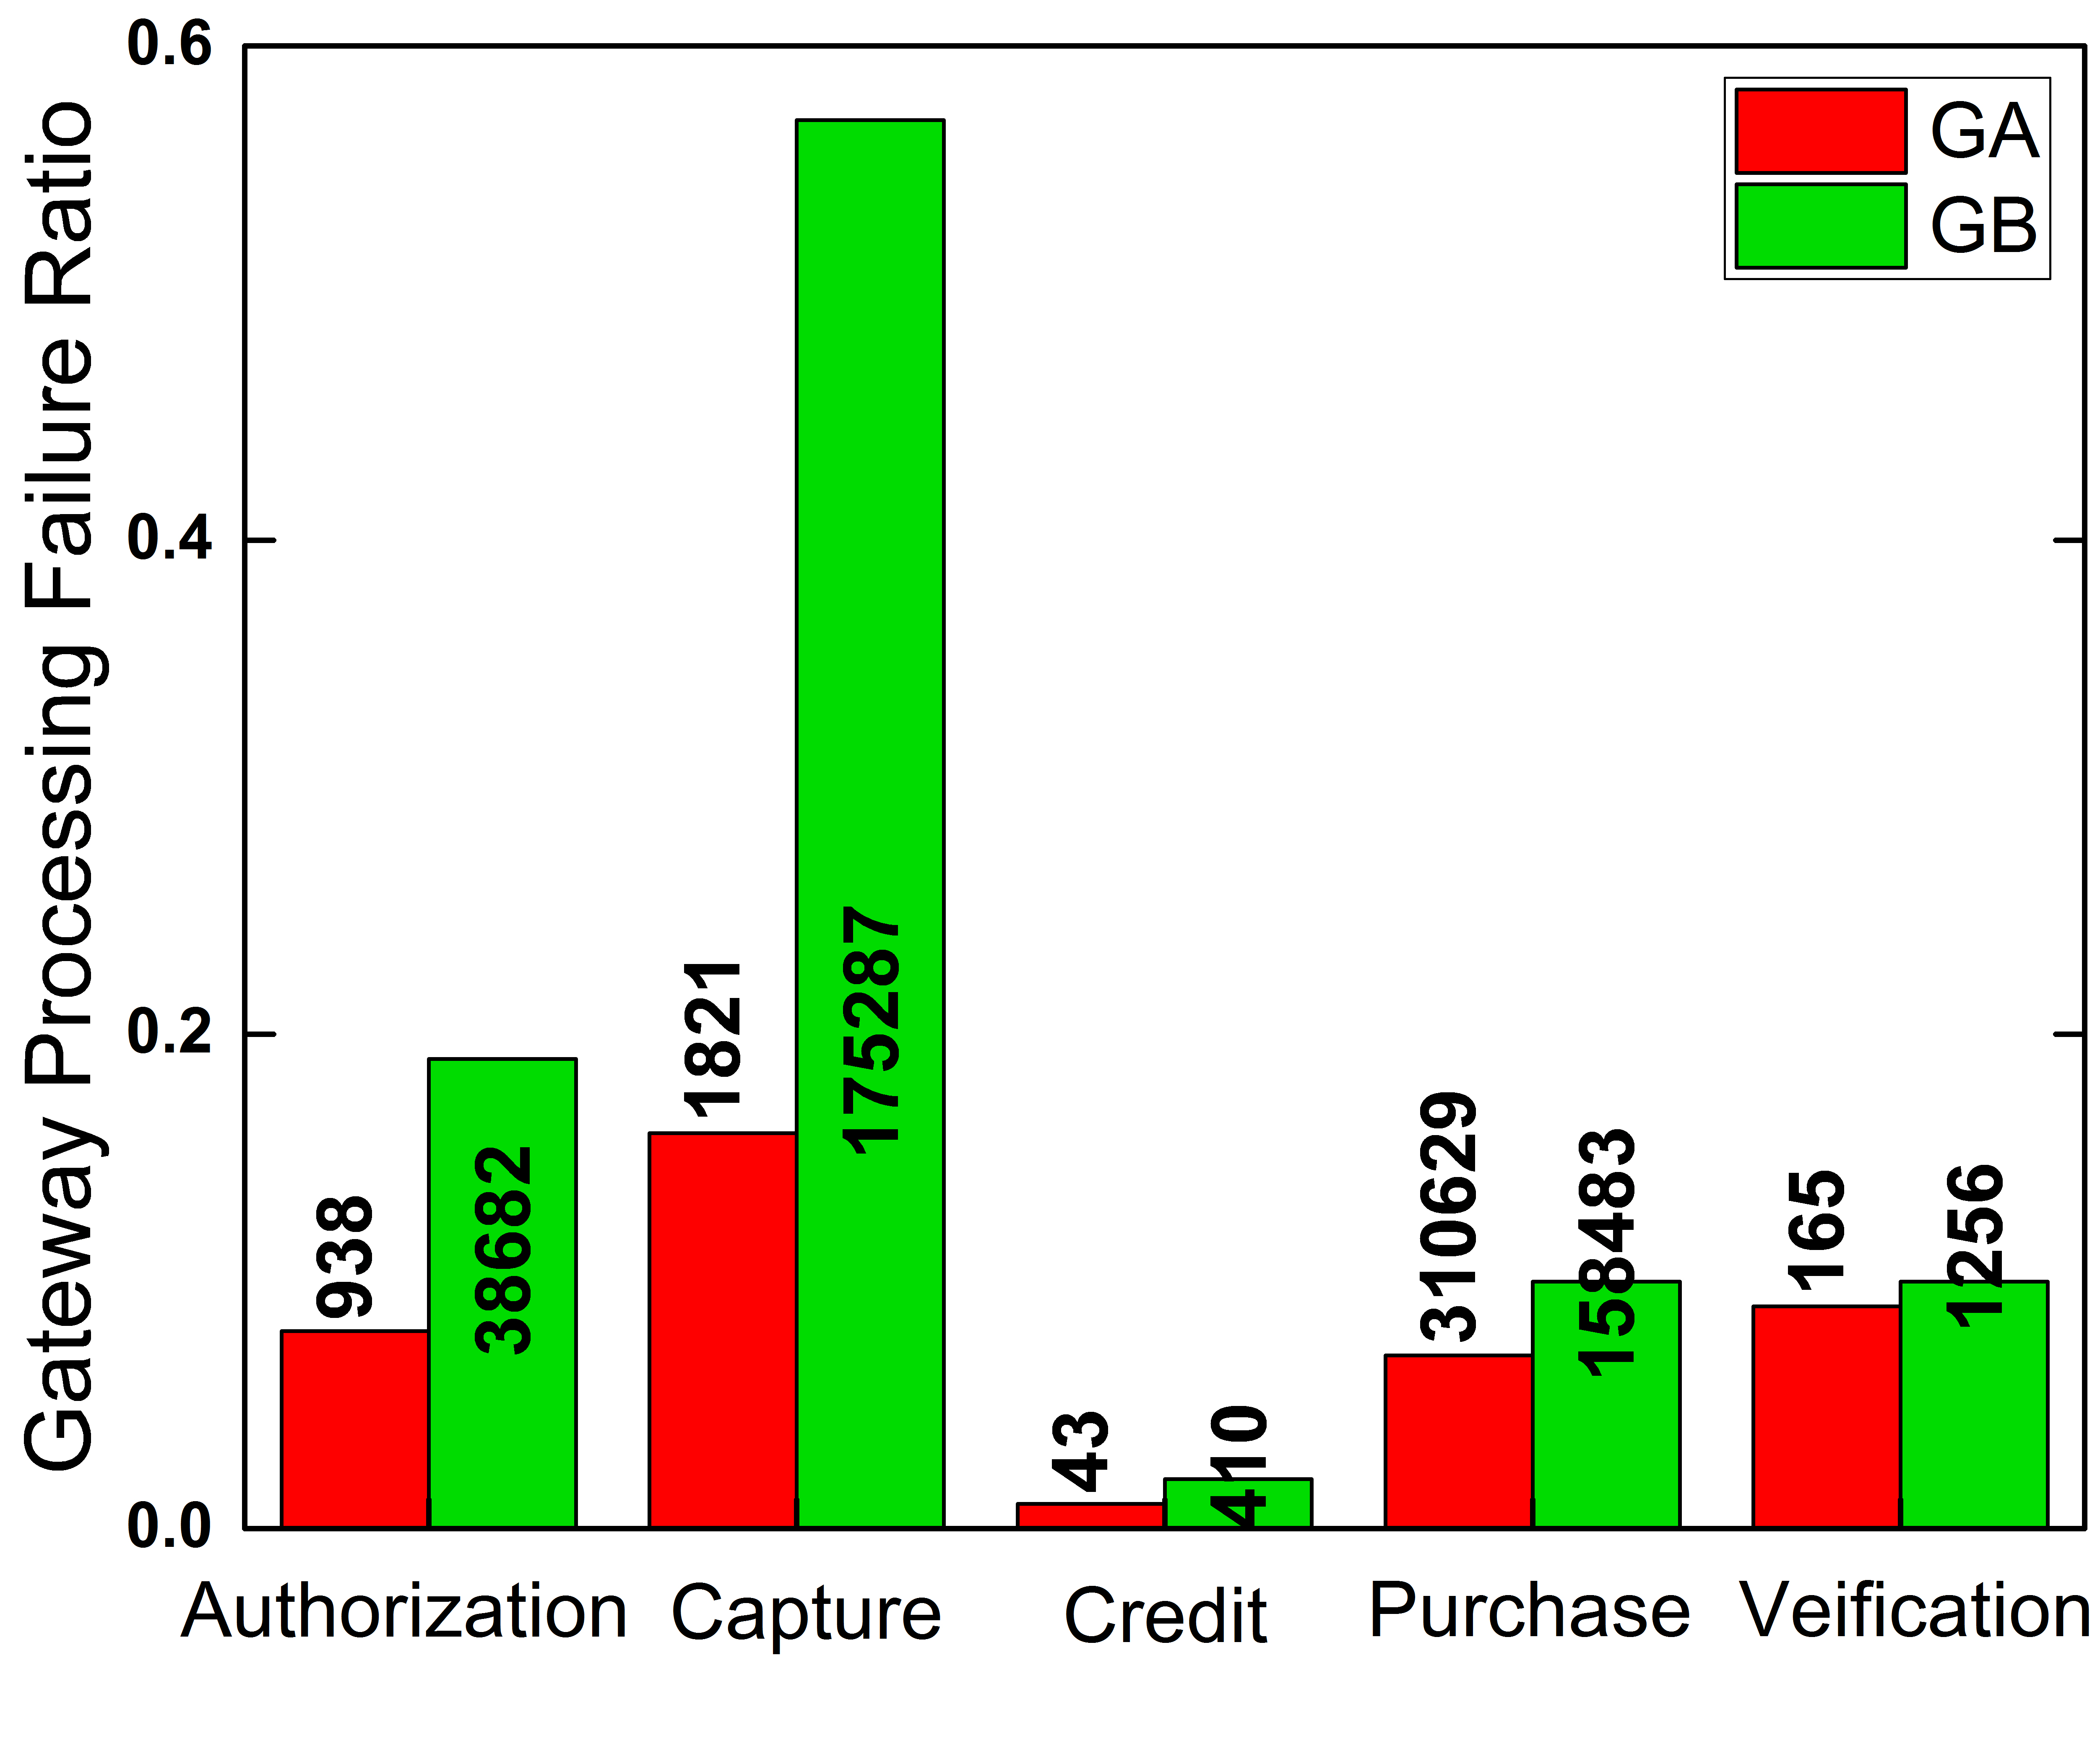
To better understand Figure 1, we need to note that GA is processing way more transactions than GB and at the same time, its failure ratio is lower in almost all transaction types. We also observe that while GB is transacting more authorizations, it also fails twice as much. GB's processing failed for capture is strikingly high.
The gateway processing failure ratio for purchases through GB is twice as much as GA while at the same time GA processes twice as many purchases (numbers of total purchases not shown here). Figure 1 shows the superior performance of the current gateway, GA, to its opponent, GB.
3. Currencies
For merchants accepting payments in different currencies, it is important that their payment gateway(s) performance is consistent for those currencies. Since our client is among these group of merchants, we knew that investigating the decline rates in different currencies would be a significant piece of information for their decision making.
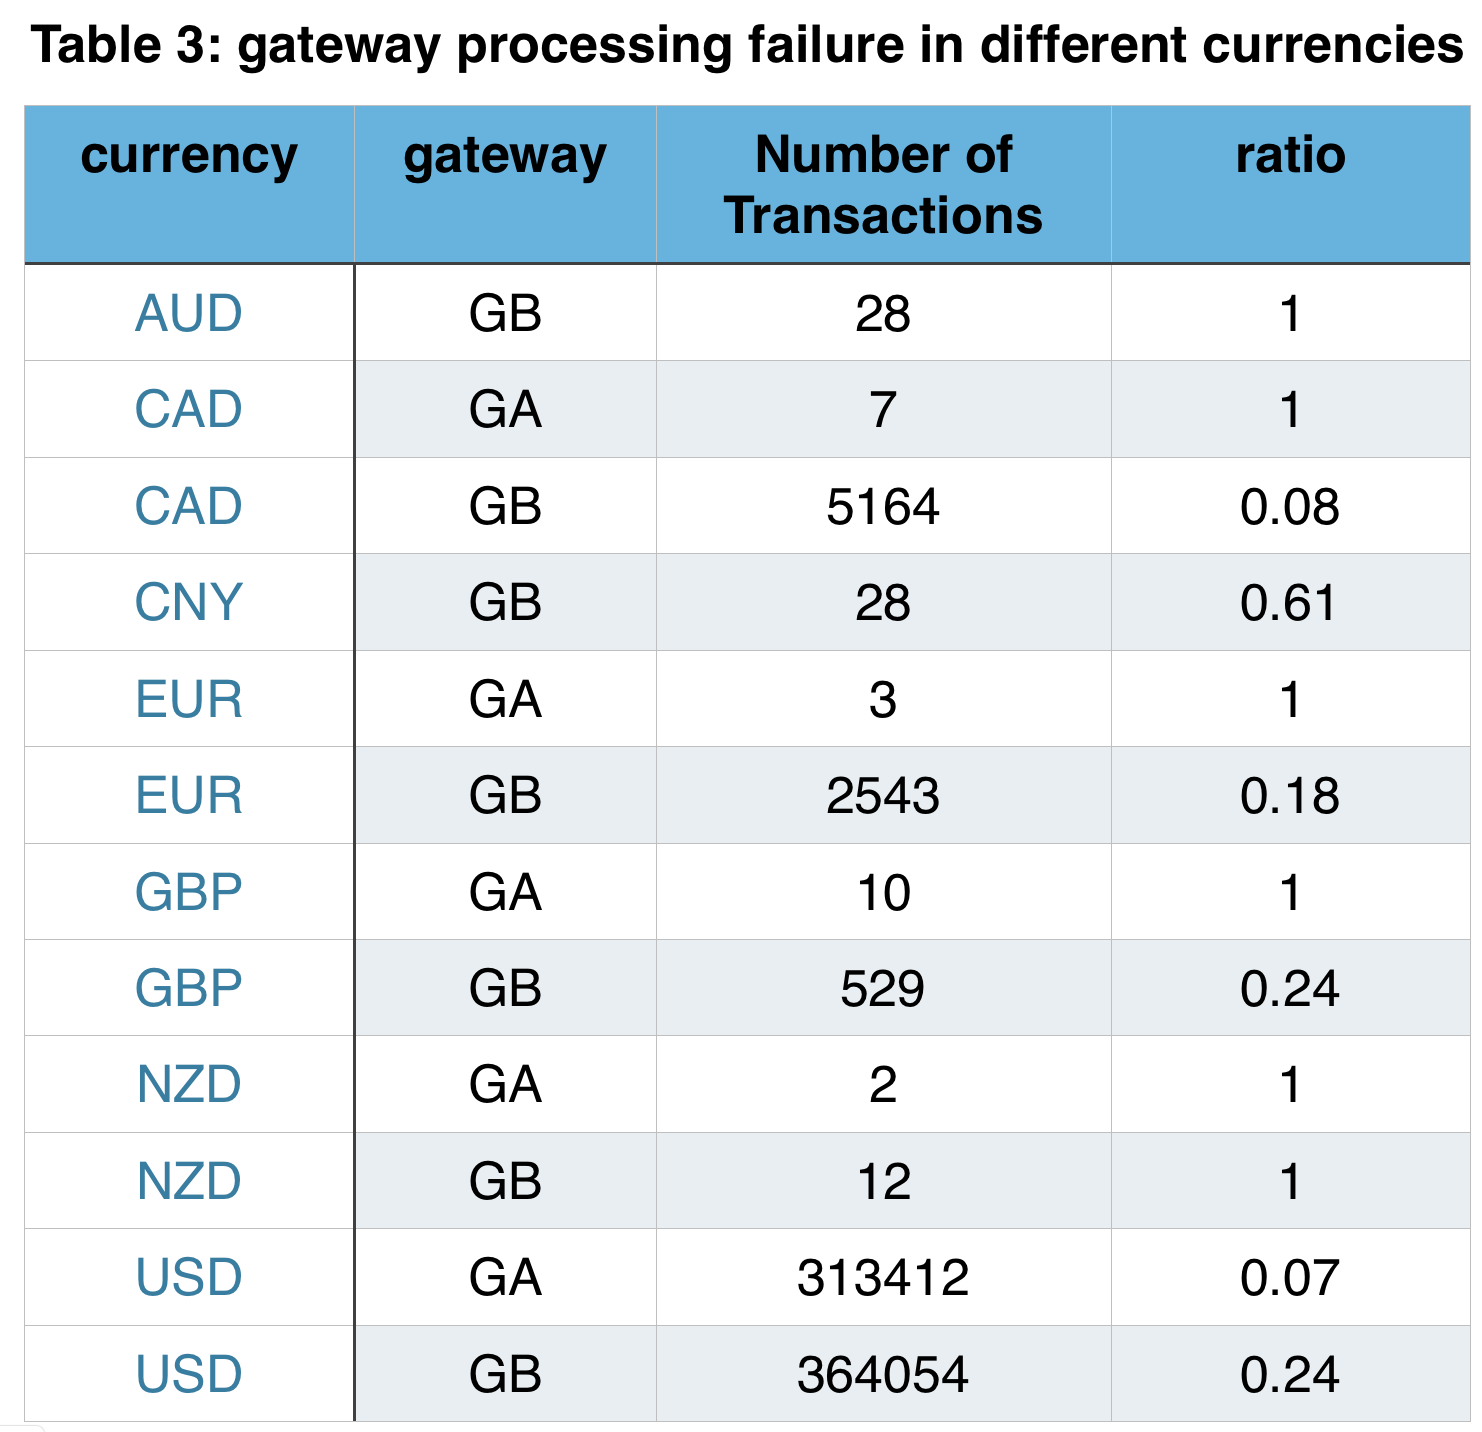
Table 3 presents the decline rates of purchases for some of the major currencies our customer use. This table includes the total number of failed transactions for each currency using GA and GB, and the ratio of failed to all purchases in that currency. From the results, one can conclude that GB is used in a diverse group of currencies while the majority of GA transactions are is USD. GA does a much better job in handling transactions in US Dollar. Not only GA transacts a much larger number of transactions in USD, its failure rate, only 7% of all purchases, in USD is much lower compared to 24% of GB. Therefore, GA is a better fit for USD and GB is a more convenient choice for other currencies.
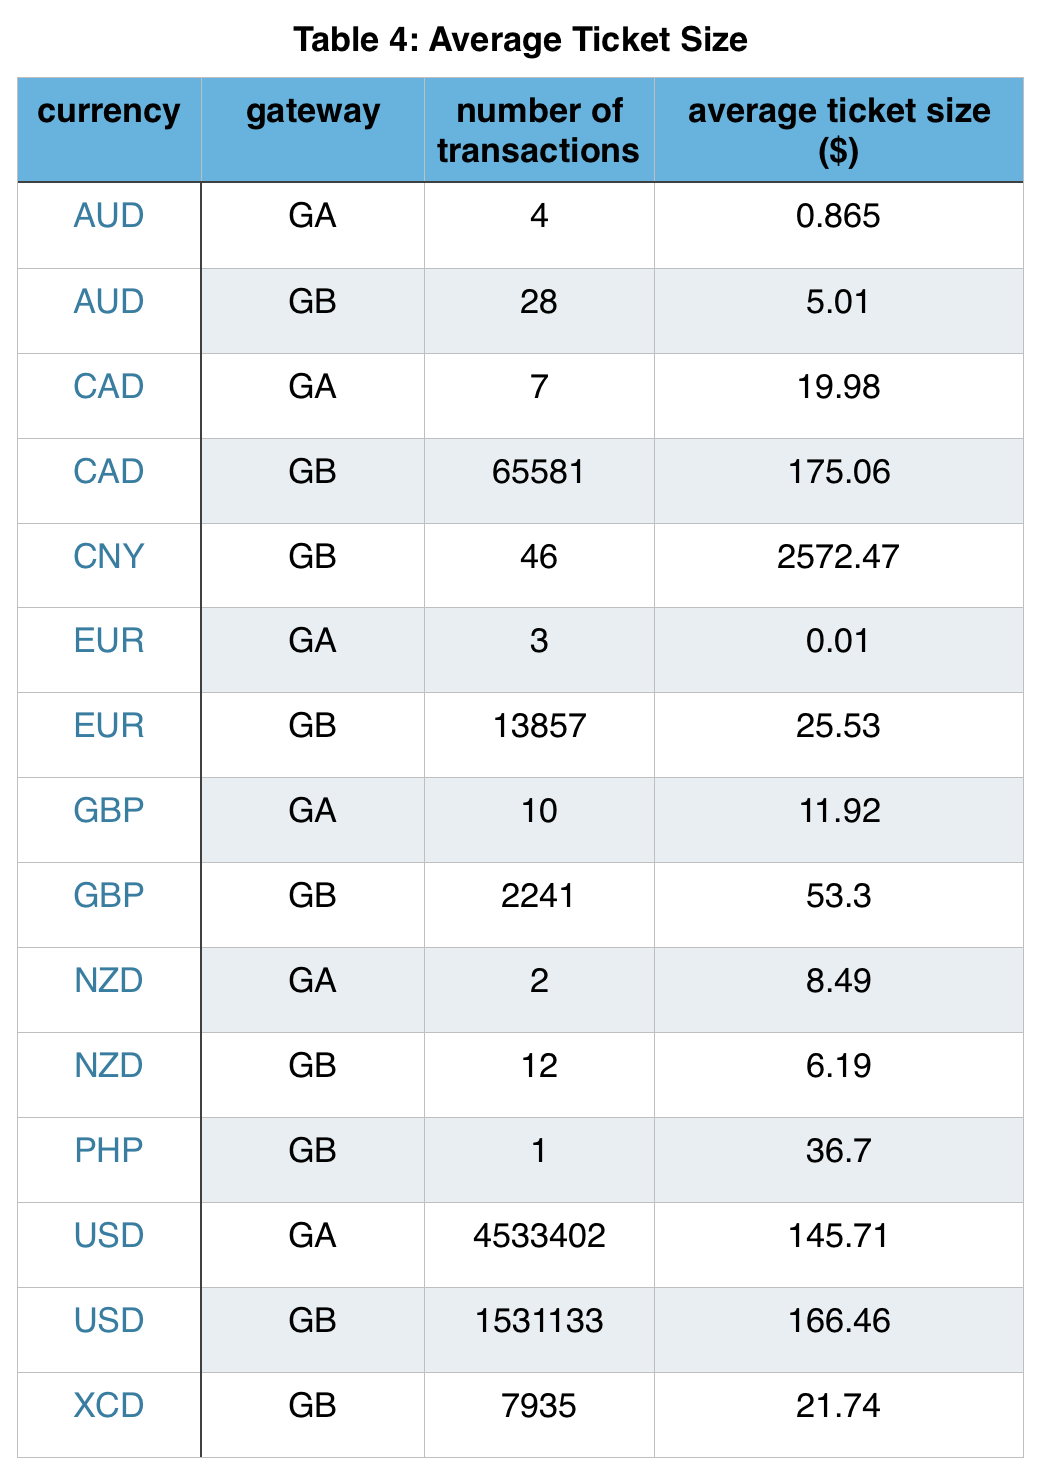
4. Average ticket size
We have seen inquiries from customers where they are thinking of sending different size tickets to different gateways. This group will in particular find the average ticket size handled by each gateway, shown in Table 4, useful. It should be noted that for the sake of comparison the average ticket size in each currency has been converted to USD based on the rate of the date were the data were generated and analyzed. Considering the number and the average ticket size, GB stands out in CAD, CNY and GBP currencies while GA does a better job in USD, as mentioned before.
5. Decline rates over time
While the total decline rates is an important factor in evaluating a gateway’s performance, it is not a good measure to evaluate its performance over time. To see how the decline rate for GA and GB evolved over time, we plot the decline rates for purchases through these two different gateways in Figure 1. The numbers next to each datapoint represent the number of transactions through GA and GB for the particular months shown, respectively.
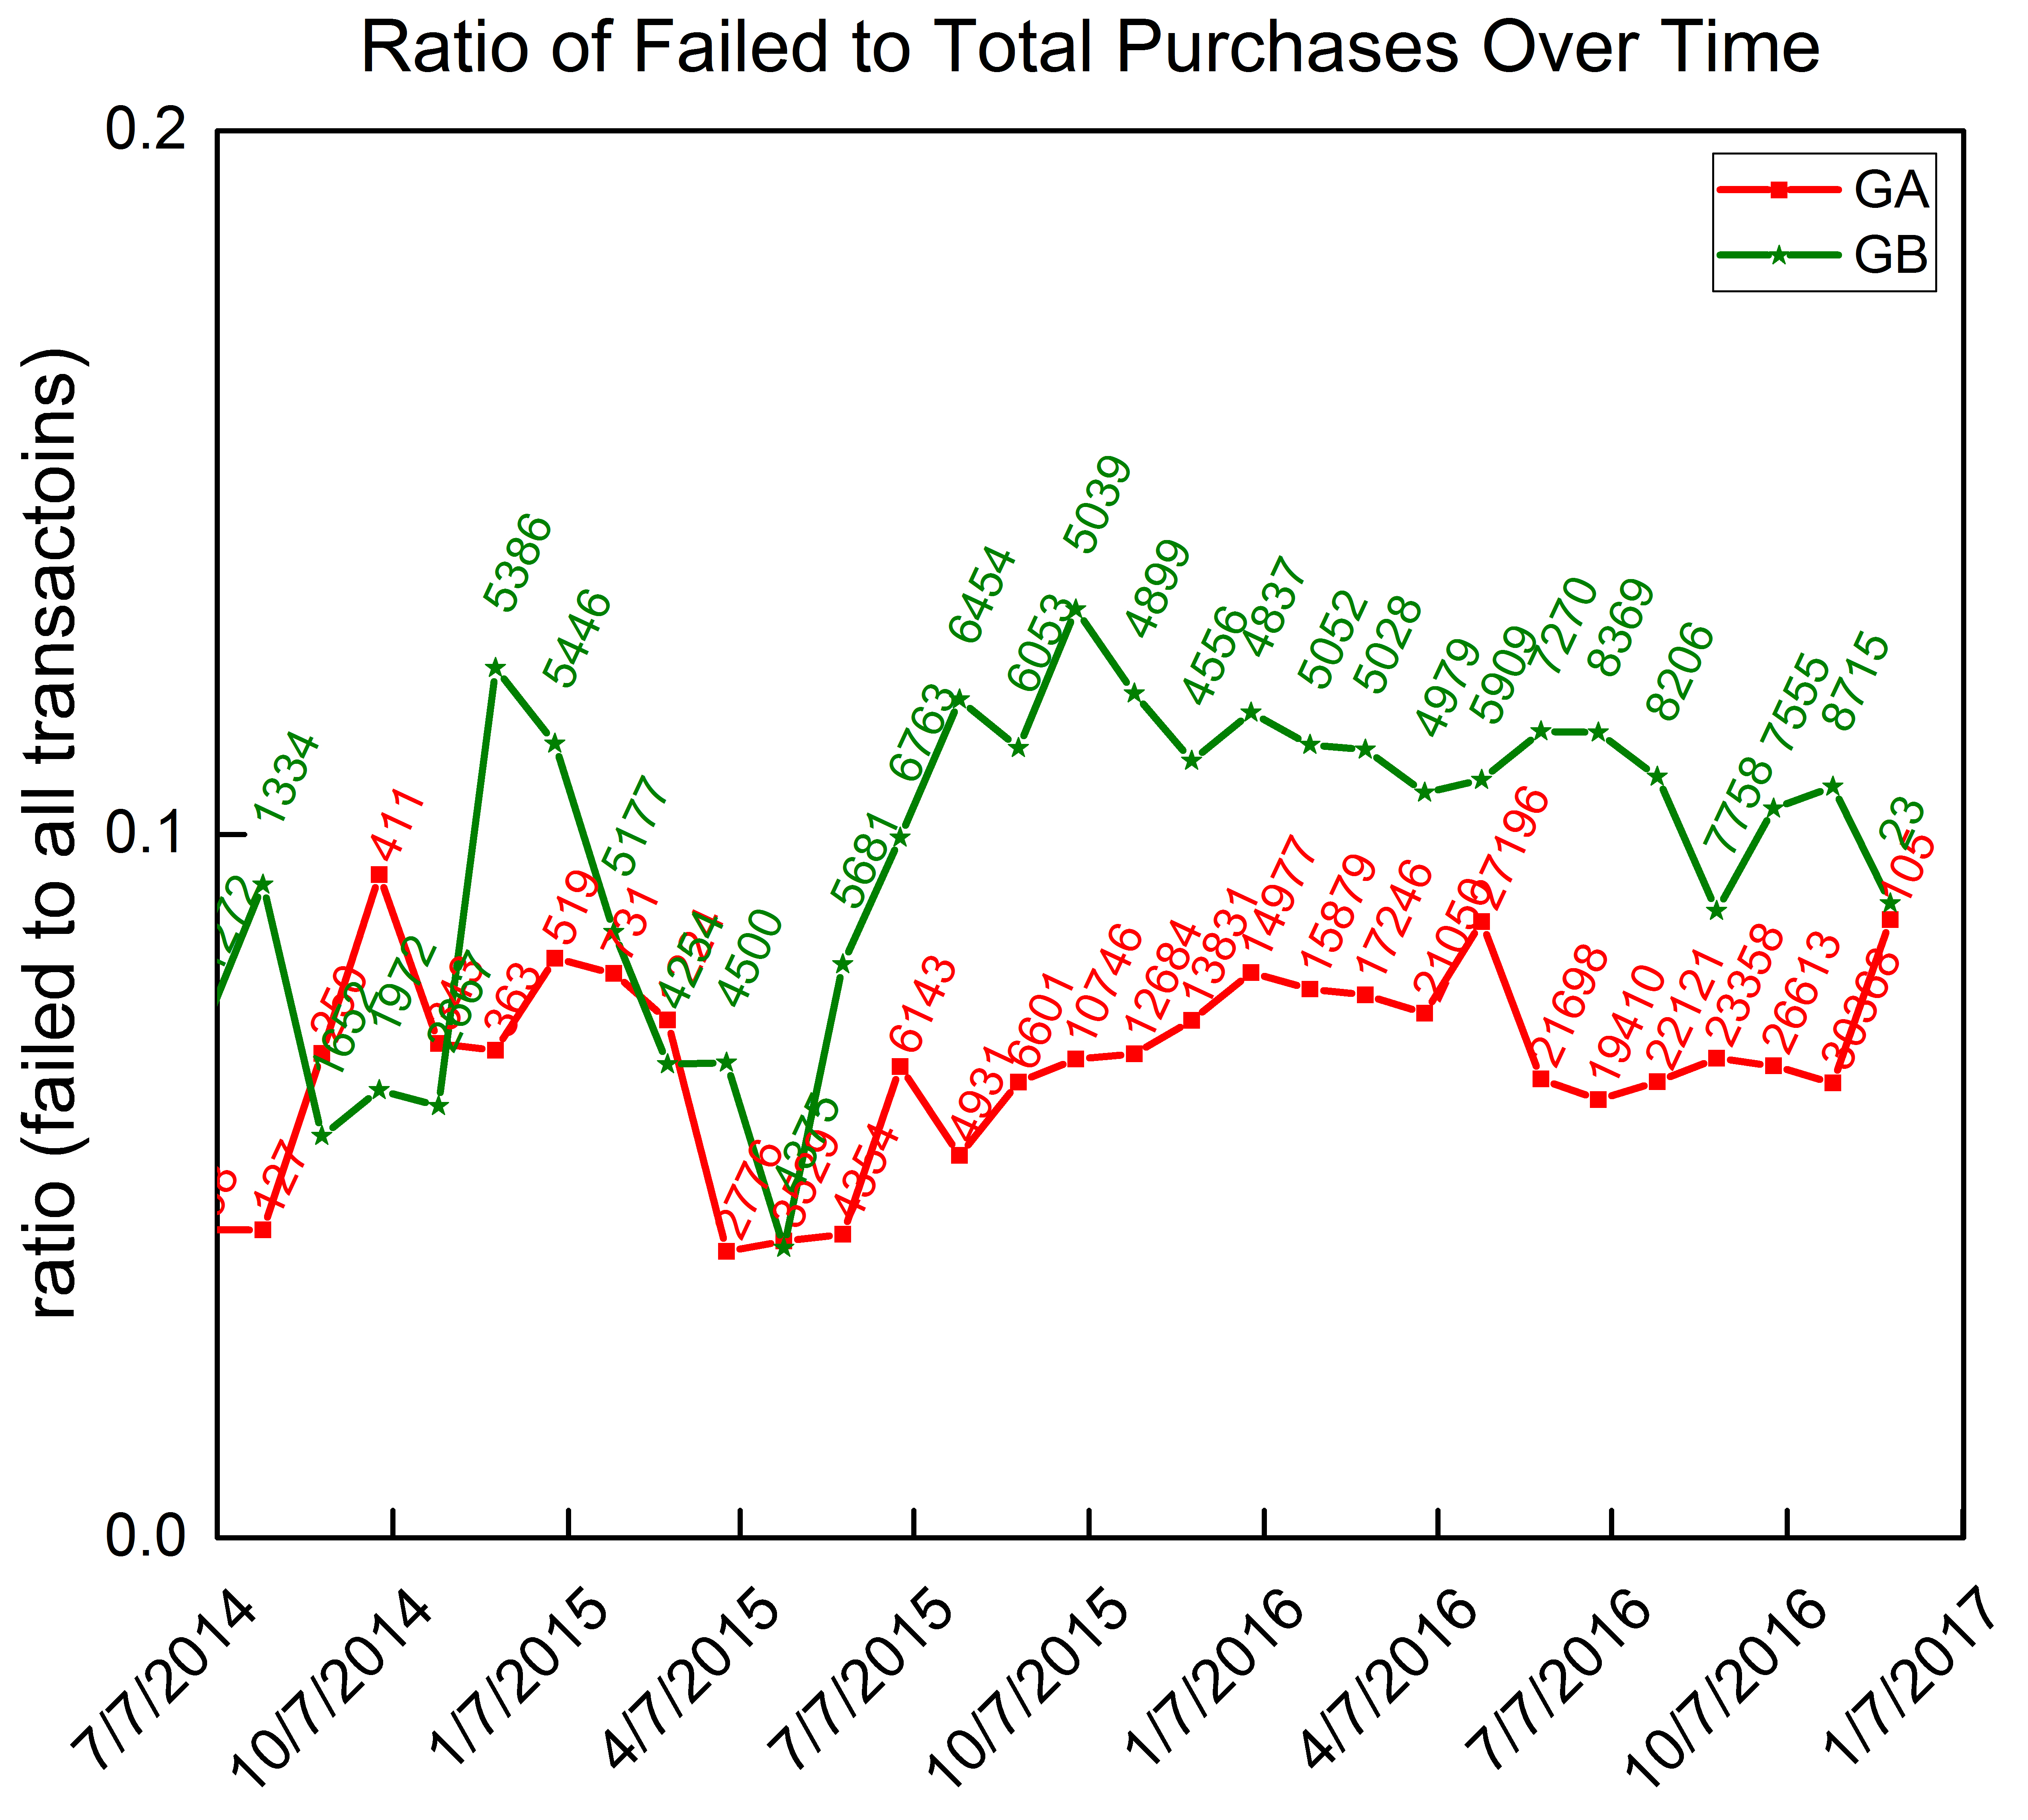
In Figure 2, GA keeps the failure rate low, while processing a larger number of transactions: it has kept the decline rate below 10% while at the same time transacting more than two times the monthly purchases compared to GB. We should remind the reader that, as discussed above, many of the GB transactions are in currencies other than USD which in turn might affect the failure rates.
6. Gateway's latency
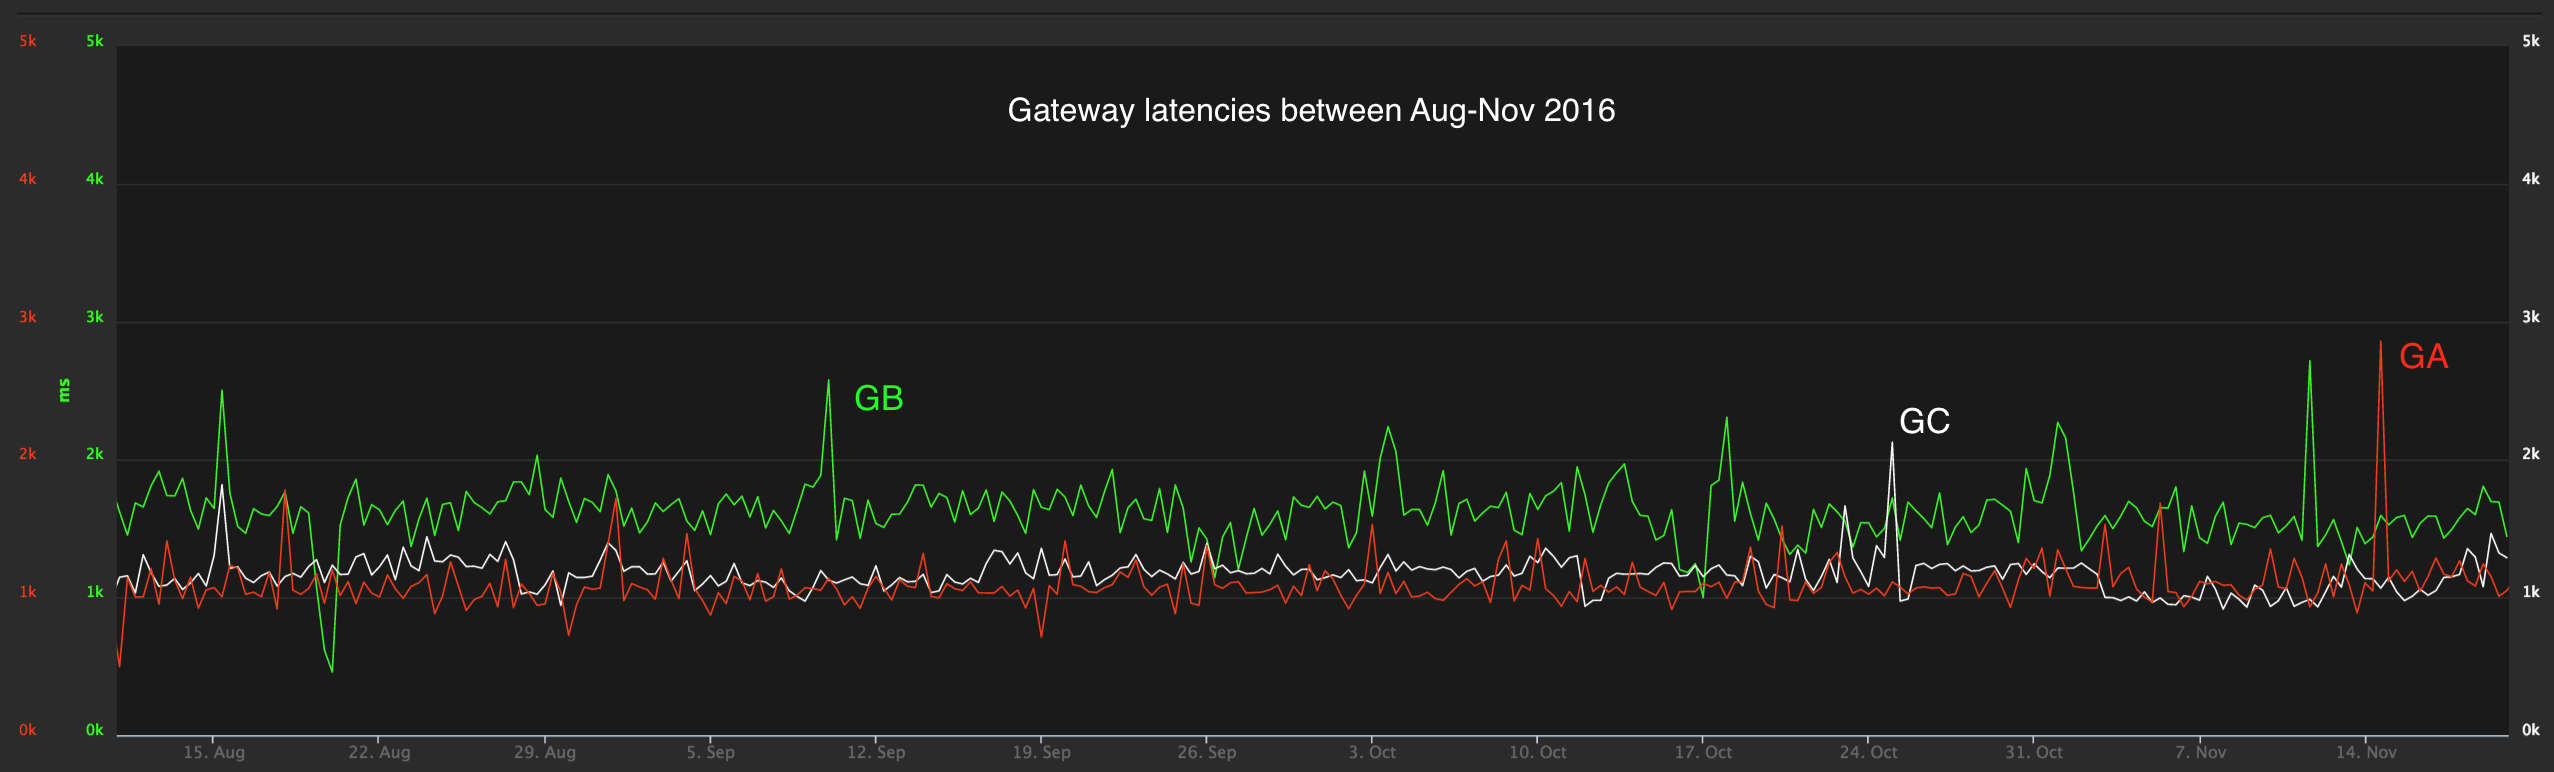
How long it takes for a gateway to process a payment is significant. The technical abilities of a gateway to handle a transaction quickly becomes even more important on occasions where millions of customers are rushing into a website to purchase a ticket for a concert or a sport event. In Spreedly this number is measured as the time between receiving a transactions to Spreedly and receiving a response from the gateway.
The response times of GA and GB are given in Figure 3 (for a better image quality please click on the figure). For comparison purposes, we have also added the latency of one of our premium gateways (GC). The latency data is plotted for the August to November 2016 time period. The vertical axis shows the latency time in milliseconds (1 mili second = 0.001 second).
Each gateway in Figure 2 has their own spike which means at unpredictable times the customers might have to deal with technical difficulties or longer response times during transaction submission. On the other hand, GC and GA both manage to keep the average latency around one second while at the same time, the average latency for GB is around 1.5 seconds.
The current gateway our customer is using, GA, has higher volumes on Spreedly including more merchants and higher transaction volumes. More importantly, they have lower decline rates and better response times. On the other hand, GB is doing a better job handling international currencies. We fed this information to our client who will use it, along with a broad array of other data points, to make a go forward decision.
Download the Multiple Payment Gateways eBook Below