.svg)
.svg)
.svg)
.svg)
.svg)

.svg)
.svg)
.svg)
.svg)


With some of the largest cities in the world, Latin America is an attractive target for both local and multinational businesses. This region has a population of over 650 million people, just under 8.5% of the world’s population. A quarter of this population is under age 14, a demographic that will increasingly rely less on cash. Instead, they’ll use more modern forms of payment that utilize mobile devices and require behind the scenes payment orchestration technology.
The complexity of doing business in Latin America can be daunting. There are many gateways to choose from. Success rates can vary widely not only by gateway but also by country, card logo, type of card, and other factors. Luckily, Spreedly is here to help solve this complexity. We have helped other customers succeed and can help your business too.
Why Success Rates Matter
Even the smallest differences in success rates can mean a large difference in revenue. For example, a hypothetical business makes 5,000 transactions a month with an average spend of $25 per transaction. If 3% of transactions fail, this business loses $3,750 per month or $45,000 per year! And, this does not include the lost lifetime value of a customer turned away by a declined transactions.
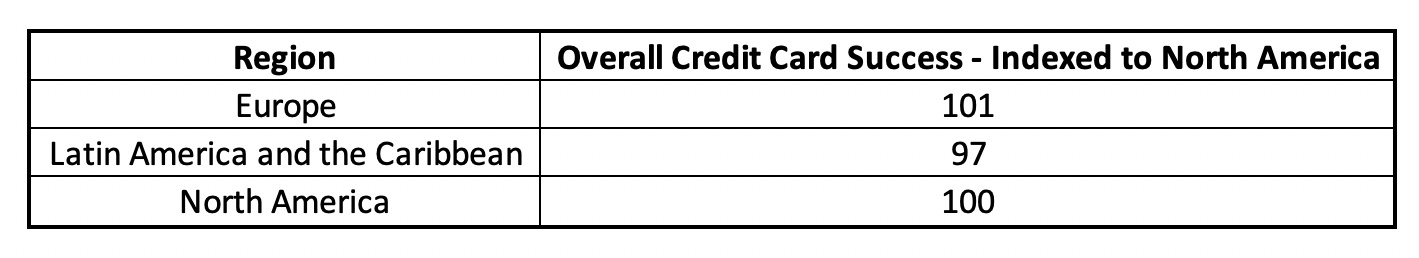
The rate of successfully processing transactions is lower in Latin America compared with other regions such as Europe or North America. The table below demonstrates this difference comparing these three regions. Latin America indexed below average (100 is the average) compared with North America and Europe.
In addition to the regional differences, we know from our extensive experience in Latin America that a gateway that works well in one country might perform very differently once you cross a border.
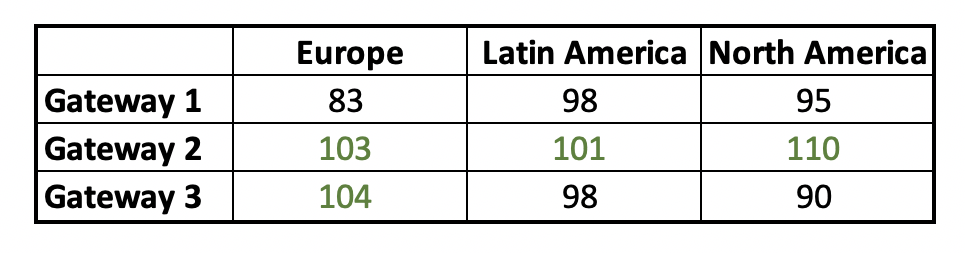
The table below shows three gateways and their performance in three regions - Europe, Latin America, and North America. Numbers are indexed to the overall average success rate. Numbers above 100 (in green) are above average. Gateway 1 consistently performs below average while 2 is above average. Gateway 3 varies in performance across regions, performing well in Europe but below average in Latin America and North America.
This difference in success rates underscores the importance of using multiple gateways, increasing the chance for a successful payment.
The Data
Our team examined 72 million domestic credit card revenue transactions occurring during the second half of 2019 in the five most populous Latin American countries: Argentina, Brazil, Colombia, Mexico, and Peru. These countries also contain many of the largest metropolitan areas, including Mexico City.
Country classification was based on the country where the card was issued. Transactions were classified as domestic if the transaction currency matched the currency one would expect based on the country of card issue. For example, if a card is issued in Colombia, we would classify a transaction in Colombian pesos as domestic. Otherwise, we classify it as international. Domestic transactions were the vast majority so this post focuses on them.
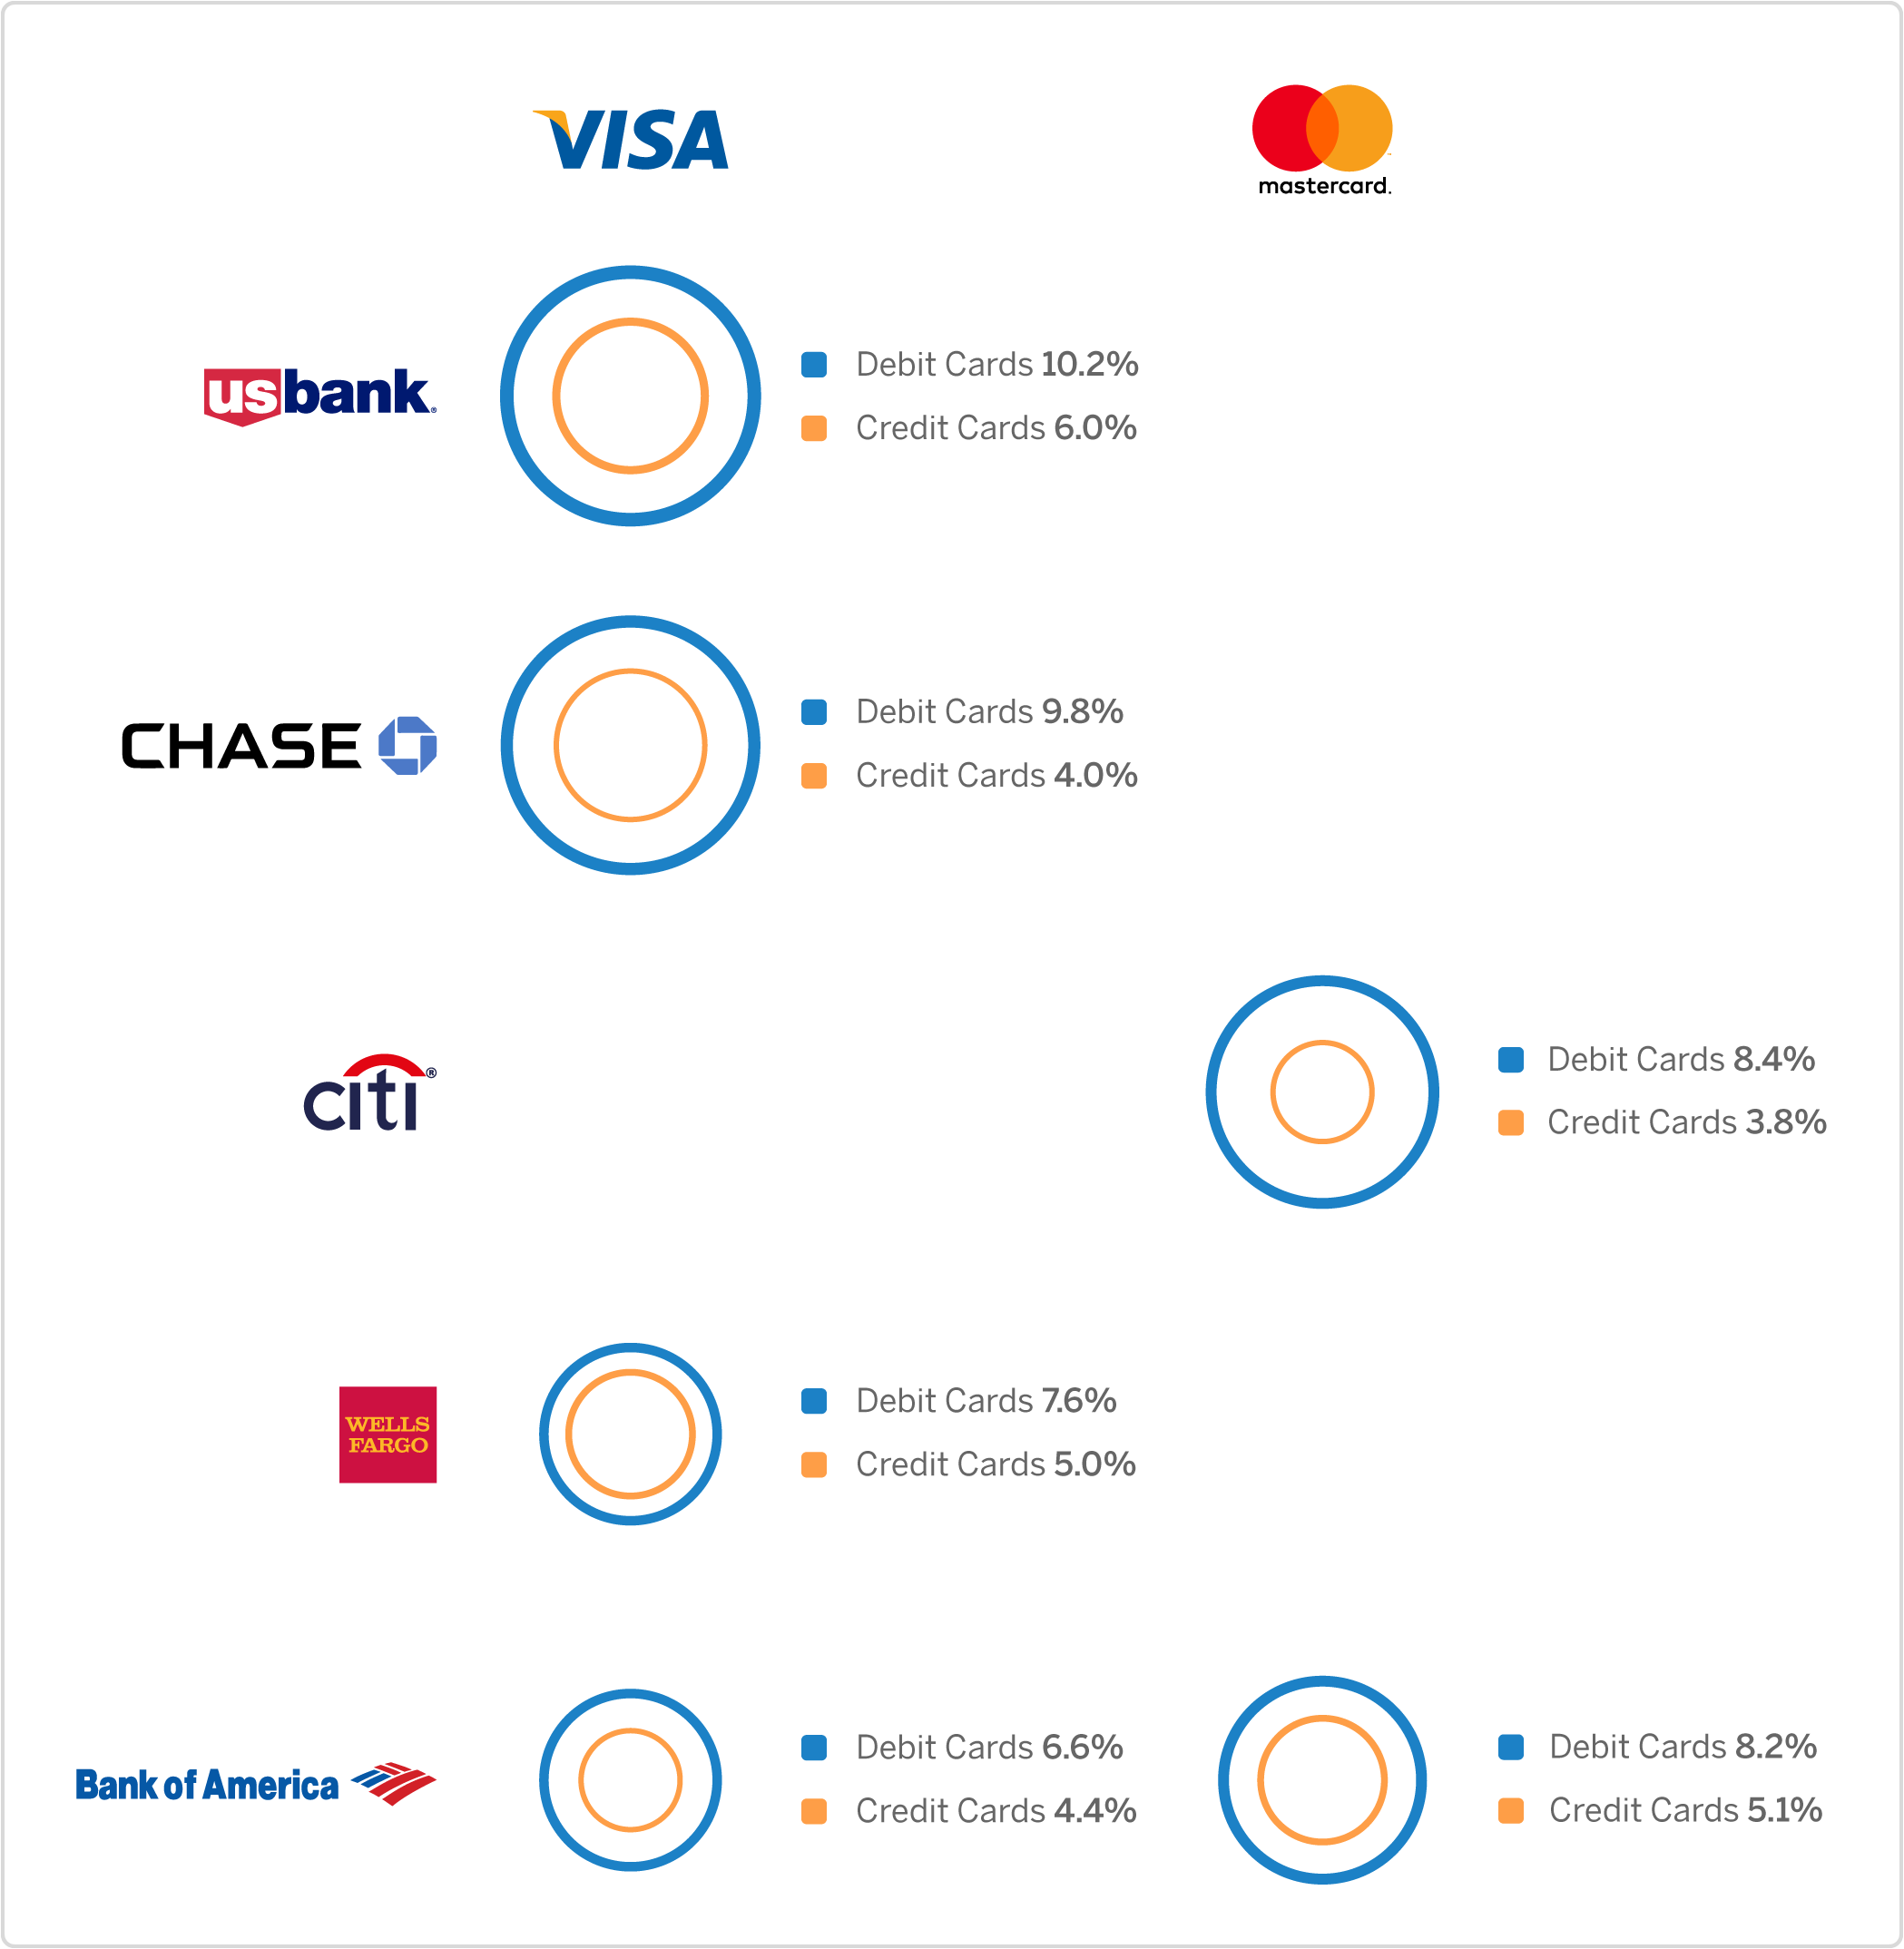
We chose credit cards because they comprised 74% of transactions. Debit card transaction success rates were highly skewed based on the issuing bank. So, we focused on credit cards which offered a more consistent look at overall success rate trends.
Any metrics that are grouped, such as card brands or card types, are only included if there are at least 50K transactions.
Success Rates
As we have seen with other regions, credit card success rates were much higher than debit cards. Overall, debit card success rates were 18% lower compared with credit cards.
Of the five countries included in this analysis, we see the highest overall credit card success rates in Peru.
The table below shows success rates by country indexed to the overall average. Those above 100 (in green) are higher than average. Colombia and Mexico are below average while Argentina, Brazil, and Peru are above.

Card Brand
Taking a closer look at credit card brands (a brand being the logo on the card such as Visa, Discover, etc.), we see wide variation across the countries in our analysis. Indexed success rates ranged from 88 (well below average) to 111 (well above average) with 100 being the overall average. This is a huge range that can mean millions in lost revenue if transactions fail.
Data is indexed to the overall success percent. An index of 100 means the success rate is average. A number below 100 is below average. A number above 100 is above average. Above average numbers are in green.
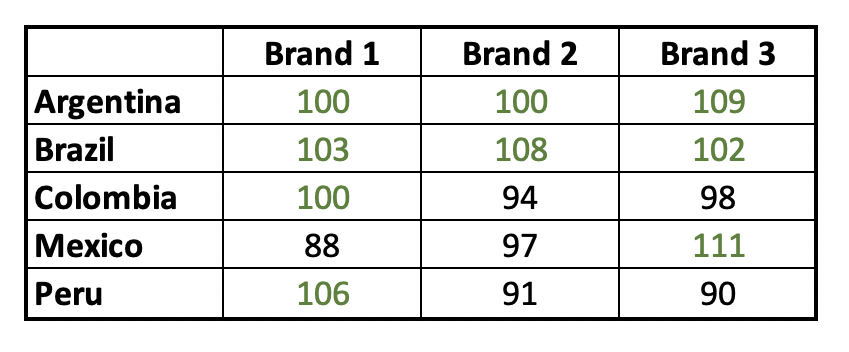
Indexed success rates in the above table ranged from 88 (far below average) to 111 (well above average). Brand 1 performed above average in 4 of 5 countries represented. Brand 2 performed above average in 2 of 5 countries, Argentina and Brazil. Brand 3 performed above average in 3 of 5 countries.
Brand 3 also had the highest overall success rate in Mexico. Mexico had both the highest and the lowest success rates on different gateways. This differential underscores the need for multiple gateways and the expertise to know which gateways have the best chance for success.
Gateway Selection
The importance of choosing the right gateway cannot be overstated. Performance varies greatly across different geographies.
The below table shows the indexed success rates of the two gateways in each country that have the most transactions. Keep in mind these may not be the same gateways in each country. Numbers in green are above average. Argentina’s top gateway indexes to the average success rate while the second highest performs above average. In Brazil and Peru, the top two gateways both have success rates above average. In Colombia and Mexico, the top two gateways both perform below average.

Conclusions from our research
Success rates are generally lower in Latin America compared to Europe and North America. But, yours don’t have to be. Know what factors influence success rates and how to optimize them. Put Spreedly’s extensive Latin American experience to work for your business. We can help you leverage multiple gateways, which is essential to increasing success rates, and expand into new markets with ease.
Next time, we take a closer look at success rates in Europe.
Want to know more about payment gateways in Latin America, and how we can help you be successful? Reach out today!
Download the Multiple Payment Gateways eBook Below