.svg)
.svg)
.svg)
.svg)
.svg)

.svg)
.svg)
.svg)
.svg)


Europe is home to over 740M people across 51 culturally diverse countries. It has a GDP close to $20T. These many geographically small countries have a highly mobile population comfortable transacting across borders, a fact that must be taken into account when doing business in Europe.
In addition, spending patterns are changing over time. According to the blog spenddesk.com, in 2017 there were more card transactions than cash. Also, the average spend per credit card is decreasing. This suggests that consumers are increasingly using cards for everyday purchases such as gas and groceries, and less for expensive purchases like travel. As this blog also points out, the spend limit for contactless payments is 30 British pounds (about $37 USD) and these transactions might have previously been cash transactions.
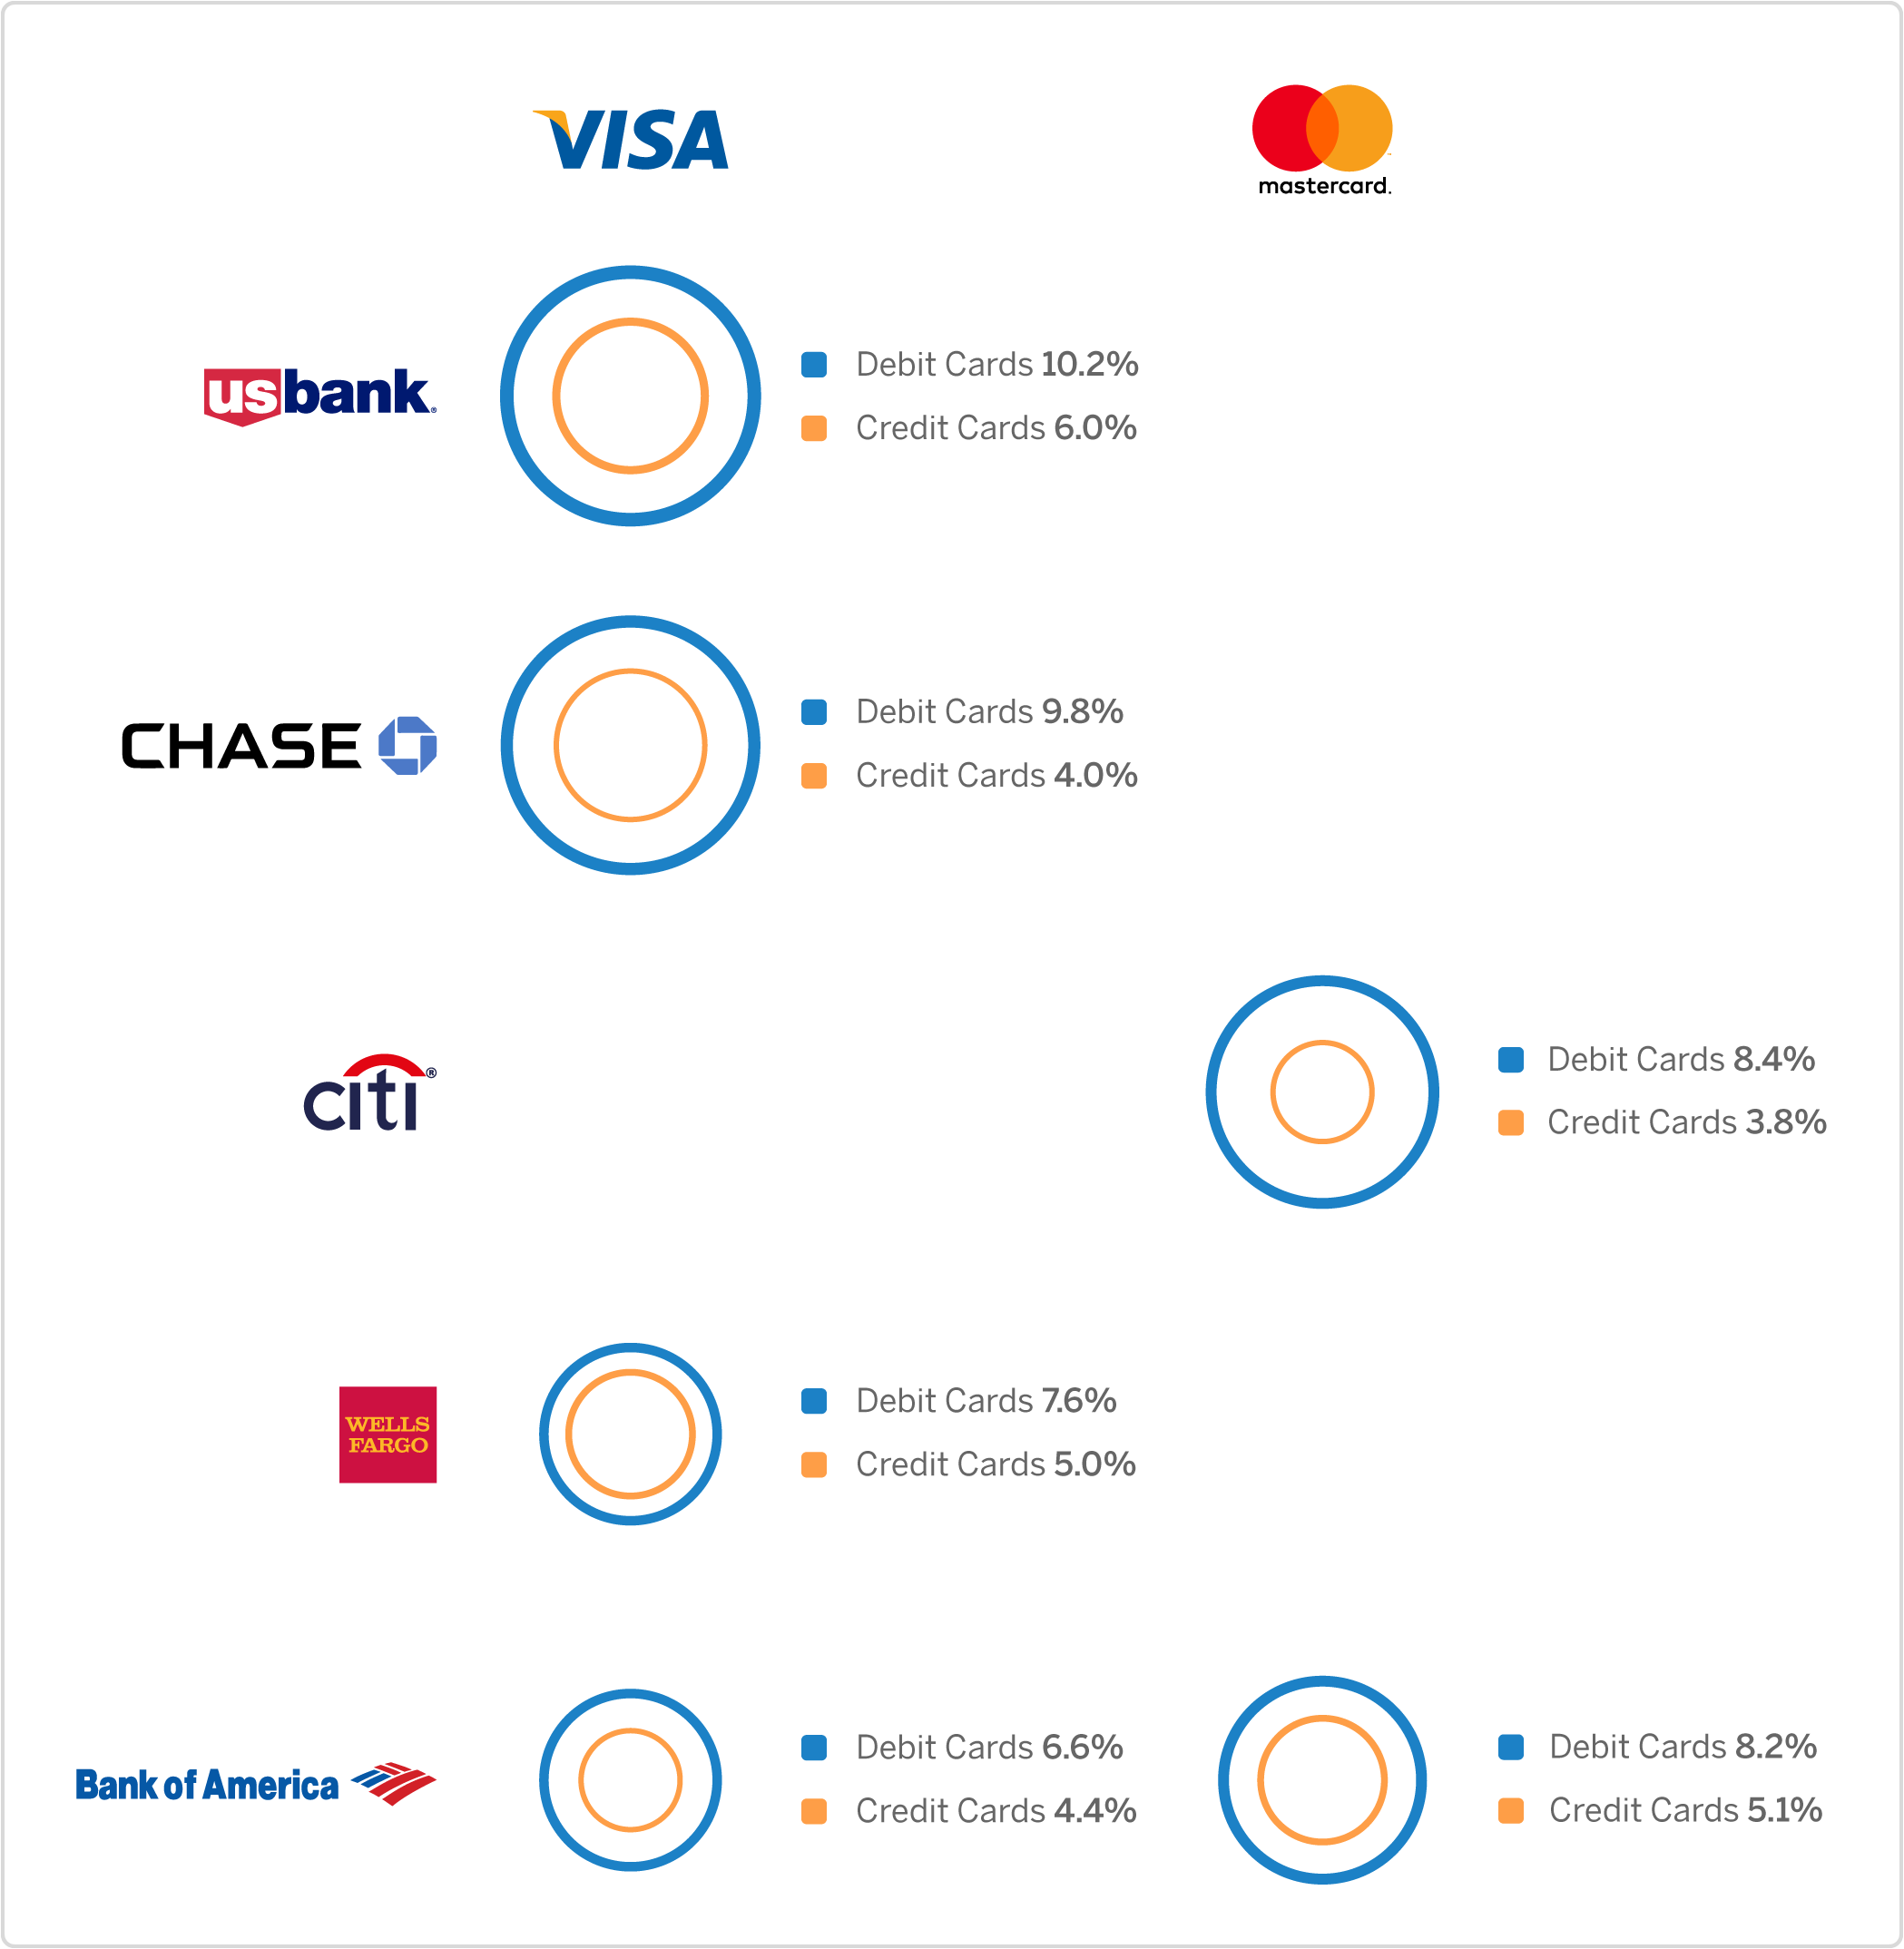
Europe is interesting for two other reasons related to payments. First, its high success rates. The other is the small difference in success rates between credit and debit cards, the lowest in the three regions we have analyzed, Europe, Latin America, and North America.
Past posts have focused on the differences in success rates between regions. The table below shows credit card success rates indexed to North America. We have seen higher success rates in Europe compared with Latin America and North America, credit cards compared with debit cards, and differences between card brands and gateways.
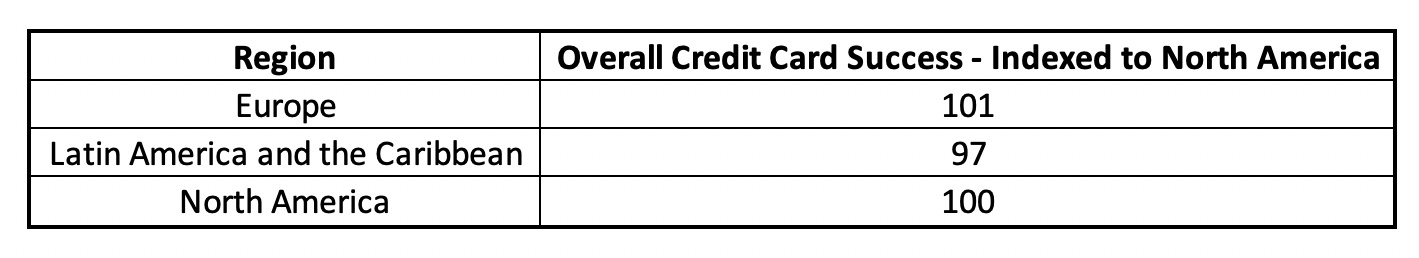
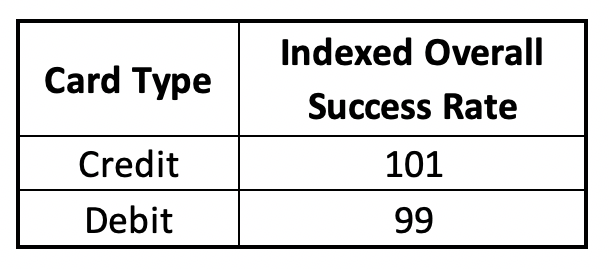
European debit card success rate index is 99 (only slightly below the overall average), the highest among the three regions. Credit vs debit success rates vary by only 2% in Europe. In Latin America and North America, we see a higher difference in the two card types. We also see a higher percentage of debit transactions. Debit transactions make up 71% of the transactions we see compared with 26% in Latin America and 57% in North America.
Even with the higher overall success rate, companies can increase their individual success rates by working with multiple payment gateways. Having multiple gateways increases the chances that a transaction will succeed.
It should also be noted that Europe is subject to more stringent card verification and regulation such as the upcoming 3DS2 regulations. For more information on 3DS2 please click here.
Data
Our team examined 15M domestic credit and debit card revenue transactions occurring during the second half of 2019. Data reflects a variety of clients across different industries and different countries.
Country or region classification is based on the country where the card was issued. Transactions were classified as domestic if the transaction currency matched the currency one would expect based on the country of card issue. For example, if a card is issued in Germany, we would classify a transaction in euros as domestic even though other countries in the EU use the euro. Otherwise, the transaction is international. Domestic transactions were the majority of transactions, so this post focuses on them. Metrics presented below are for domestic transactions unless otherwise noted.
Transaction Success Differences
Even with this high rate of debit card success, there are differences based on country and type of card. Of countries meeting a minimum number of transactions, the UK and Spain had the highest debit card success rates indexing at 103 and 101 respectively.
The top three major brands (in terms of transaction volume) indexed between 99 and 104 compared with overall debit card success.
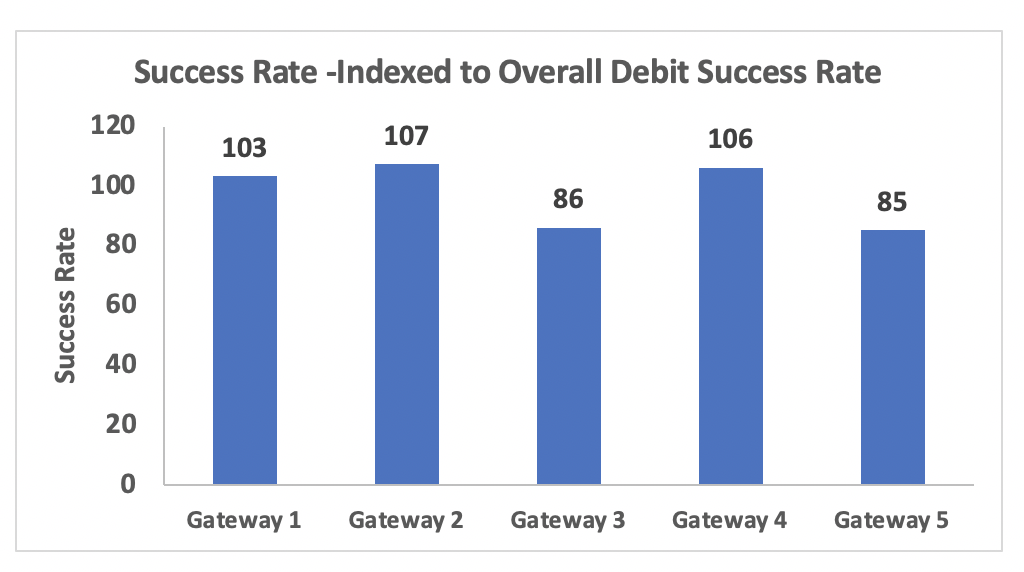
The top five gateways (by volume) indexed from 85 to 107. The graph below shows the top five gateways (by volume). Gateway 1 is the highest. Two of the five gateways, noted below as numbers 3 and 5, indexed below the average debit card success rate.
Even small differences in success rates can mean millions in revenue and the difference between customer satisfaction and customer churn. Success rates are higher in Europe compared with other regions. But, there is a lot of variability by country, gateway, card brand, and other factors. Intelligently routing transactions, even in places with a higher than average success rate, is where Spreedly can help.
Download the Multiple Payment Gateways eBook Below